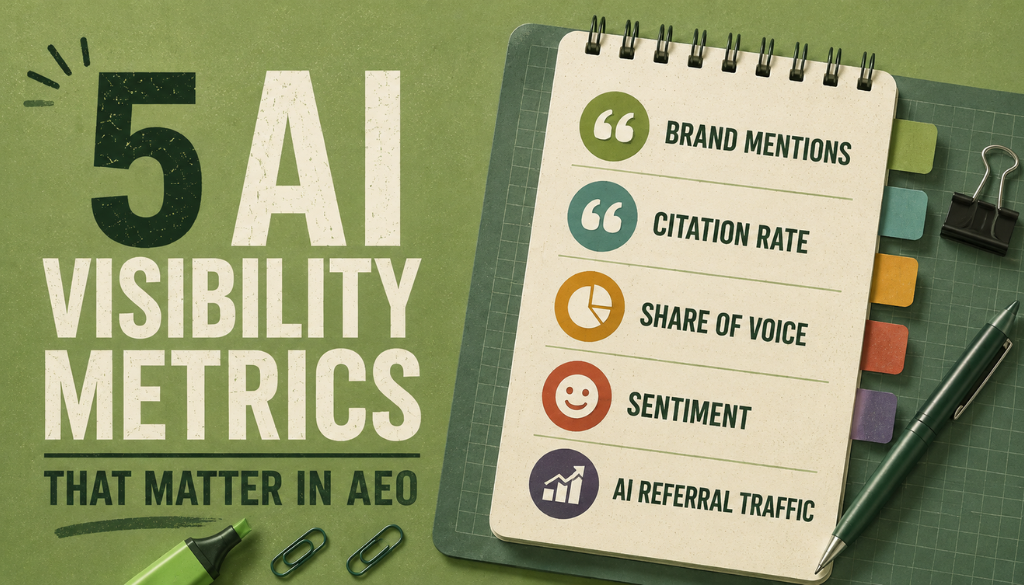
Short Answer: Which AI visibility metrics actually matter?
Five: citation rate, brand mention rate and AI share of voice, citation position, representation accuracy and sentiment, and AI referral traffic and conversion quality. Together they answer whether AI systems mention you, how you compare with competitors, how prominently and accurately you are presented, and whether any of it produces business results. No single metric covers the picture.
Quick Summary
- Citation rate measures whether your brand appears in AI answers at all — the foundational metric.
- Share of voice and citation position reveal how you compare with competitors and how prominently you are presented.
- Representation accuracy and sentiment show whether AI describes you correctly and favourably.
- AI referral traffic and conversion quality connect visibility to visits, leads, pipeline, and revenue.
- AEO measurement is not standardised, so consistent prompts, rubrics, platforms, and cadence matter more than any single result.
Most AEO reporting fails in one of two directions. Either it celebrates a healthy citation rate without checking whether the AI is describing the brand correctly, or it dismisses AEO entirely because referral traffic looks thin.
Both mistakes come from measuring one thing. These five metrics are ordered deliberately, from bare presence through to revenue, so each tier catches what the one before it misses.
What are AI visibility metrics in AEO?
They measure whether and how a brand appears in AI-generated answers across ChatGPT, Google AI Overviews, Perplexity, Gemini, and Microsoft Copilot. Traditional SEO tracks rankings and clicks. Answer Engine Optimization also tracks citations, competitive share of voice, prominence, representation quality, and downstream business impact.
Zero-click interactions are what force the distinction. An AI model can recommend your brand without the user ever visiting your site, leaving click-based analytics with nothing to record.
Worth saying plainly: AEO measurement is not yet standardised. Different tools define and calculate these metrics differently, which is why methodology consistency beats tool choice.
| Tier | Metrics | What the tier tells you |
|---|---|---|
| Tier 1 — Visibility | Citation rate, AI share of voice | Does AI know your brand, and how do you compare? |
| Tier 2 — Engagement | Citation position, representation accuracy, sentiment | How prominently and accurately does AI present you? |
| Tier 3 — Business outcomes | AI referral traffic, conversion quality | Does visibility drive visits, leads, and revenue? |
What is citation rate, and how do you calculate it?
Citation rate — also called answer inclusion rate — is the percentage of relevant queries where an AI system mentions your brand or links to your domain at least once. It answers a binary question: do you appear at all?
Citation Rate = (Queries where your brand is cited ÷ Total relevant queries tested) × 100
Test 50 buyer-intent prompts in ChatGPT and appear in 15 responses, and your ChatGPT citation rate is 30%.
Mention rate versus citation rate
Mention rate counts how often your brand name appears anywhere in an answer, even in passing. Citation rate counts how often the AI explicitly cites or links your content as a source. The terms get used interchangeably, but they measure different things — we unpack the distinction in brand mentions versus brand citations.
A quality citation draws on your data, expertise, or viewpoint. Being listed alongside four competitors is not the same achievement.
The limitation you have to design around
Citation rate is binary. A passing footnote and a primary recommendation each count as one appearance, despite being worth completely different amounts. That single flaw is why the other four metrics exist.
What are brand mention rate and AI share of voice?
AI share of voice measures your citations as a percentage of all brand citations across a defined query set. It supplies the competitive context that absolute counts lack.
AI Share of Voice = (Your brand’s citations ÷ Total citations for all brands in the set) × 100
A 40% citation rate sounds strong right up until you find your main competitor sitting at 75% for the same queries. Share of voice is what turns a number into a judgement.
What it looks like across platforms
A project management brand tracking the query set “best project management tools” might see:
| AI platform | Your citations | Competitor A | Competitor B | Total | Your share of voice |
|---|---|---|---|---|---|
| ChatGPT | 8 | 12 | 6 | 26 | 30.8% |
| Google AI Overviews | 5 | 10 | 8 | 23 | 21.7% |
| Perplexity | 7 | 9 | 7 | 23 | 30.4% |
| Gemini | 4 | 11 | 5 | 20 | 20.0% |
| Microsoft Copilot | 6 | 8 | 6 | 20 | 30.0% |
That brand is competitive in ChatGPT, Perplexity, and Copilot, and trailing in Google AI Overviews and Gemini — which tells you exactly where the next optimisation effort belongs. For the prompt set behind this kind of analysis, see the 10 prompts to run every week.
What is citation position, and why does placement matter?
Citation position measures where your brand sits within the answer. It separates being the first recommendation from being buried in a closing footnote.
Not all citations are worth the same. First mention carries more perceived authority, and likely more click probability, than last place in a comparison.
How to score it
AI answers have no fixed numbered ranking, so you need a consistent rubric:
| Position in the answer | Weight |
|---|---|
| First brand mentioned, or primary recommendation | 3 points |
| Mid-answer mention, or listed among peers | 2 points |
| Footnote, end-of-answer, or passing reference | 1 point |
Average the weights across your prompt set for a composite score. Trending toward 3.0 means AI engines treat you as a primary authority. Near 1.0 means you are present but not prominent.
Why it only works measured over time
AI answers are probabilistic. The same prompt returns different outputs on different days and in different sessions. One answer is a snapshot, not a rank.
Position and accuracy also have to be read together. A first-position citation that explains your value proposition correctly is worth far more than a prominent but misleading one.
What do representation accuracy and sentiment measure?
Accuracy measures whether AI correctly describes your products, pricing, features, differentiators, and positioning. Sentiment measures whether that description is positive, neutral, or negative.
Being mentioned only helps if the portrayal is right. An inaccurate or hostile answer can do more damage than absence.
| Dimension | Rating | Description |
|---|---|---|
| Accuracy | Accurate | All facts about the brand are correct |
| Accuracy | Partially accurate | Some facts correct, others missing or wrong |
| Accuracy | Inaccurate | Key facts — pricing, features, positioning — are wrong |
| Sentiment | Positive | The brand is recommended or praised |
| Sentiment | Neutral | The brand is listed without an opinion |
| Sentiment | Negative | The brand is criticised, or users are cautioned against it |
The target is Accurate + Positive. The emergency is Inaccurate + Negative — the AI is both misrepresenting you and framing you badly.
Why this affects conversion directly
An answer might describe a paid product as free, or claim a company is a subsidiary of its competitor. Errors like that disqualify prospects before they ever reach your site. Monitoring accuracy catches them early enough to correct the underlying source, and publishing clear authoritative content lets models self-correct over time — the discipline behind answer capsules and citation-friendly list formats.
What are AI referral traffic and conversion quality?
The business-facing tier: visitors, leads, and conversions arriving from AI answers, whether through direct citation links or AI-influenced discovery.
Early data suggests these visitors can be unusually well qualified, because they arrive after receiving a contextual recommendation rather than clicking a blue link. They may convert better than traditional organic traffic.
The zero-click gap
The zero-click gap is the share of AI-influenced activity that never produces a trackable referral. Someone sees a recommendation, searches your brand three days later, and arrives as branded search or direct traffic. Even correct channel segmentation will undercount AI’s real influence.
Proxy signals worth watching
- Branded search volume lift: rising branded searches are a downstream echo of AI exposure.
- “How did you hear about us?” responses: surveys catch what analytics cannot.
- Conversion-rate differentials: comparing AI-referred sessions with other channels quantifies quality.
- Influenced pipeline: opportunities with an AI touchpoint — the strongest signal, because it reaches past awareness into revenue.
How to set up AI referral tracking
- Identify AI referral sources in analytics: chatgpt.com, perplexity.ai, gemini.google.com, copilot.microsoft.com.
- Create a custom AI / LLM Traffic channel group so these visits stay separate from organic and direct.
- Track conversion events for that channel — forms, sign-ups, purchases.
- Monitor branded search volume in Search Console or your keyword tool.
- Compare conversion rates between AI-referred sessions and other channels.
For platform-specific setup, see tracking Microsoft Copilot and Bing AI visibility and tracking Google AI Mode visibility.
How do you measure defensibly across platforms?
With a representative query set, multiple platforms, a fixed rubric, and repeated testing. One-off spot checks are not evidence, because AI responses vary by session.
What data each platform actually gives you
| Platform | Native publisher data | Metrics trackable | Key limitation |
|---|---|---|---|
| ChatGPT | None | Citation rate, position, sentiment | No publisher analytics; outputs vary by session |
| Google AI Overviews / AI Mode | Search Console generative AI report | Citation rate, position, referral traffic | AI Mode still evolving; limited history |
| Microsoft Copilot / Bing | Bing Webmaster Tools AI Performance | Grounding queries, citation share, page-level counts | Answers vary by integration surface |
| Gemini | Limited | Citation rate, position, sentiment | Distinct from AI Overviews; less publisher data |
| Perplexity | None | Citation rate and position via inline links | Strong citation format, no publisher dashboard |
| Claude | None | Citation rate, position, sentiment | Does not browse the web in all modes |
Only Google and Microsoft offer first-party data. Everything else requires manual auditing or third-party tools, which is worth knowing before you promise a stakeholder a dashboard.
What cadence should you use?
- Build a controlled set of 20–50 buyer-intent questions for your category.
- Run every prompt across your target platforms, in fresh sessions to reduce personalisation bias.
- Record appearance, position, accuracy, and sentiment.
- Calculate citation rate, share of voice, and position with consistent formulas.
- Repeat monthly, or more often during active optimisation.
- Compare trends rather than snapshots.
A spreadsheet gives budget-constrained teams genuinely useful directional data — pair it with branded-search proxies and surveys. Purpose-built AEO tools automate more of it, often refreshing citation data every 24 to 48 hours.
How should you report this to stakeholders?
Through a three-tier scorecard that connects leading indicators to business results. Stakeholders do not care about citation rate in isolation; they care about pipeline.
| Tier | Metric | This month | Trend | Target |
|---|---|---|---|---|
| Visibility | Citation rate | 34% | ↑ | 40% |
| Visibility | AI share of voice | 28% | → | 35% |
| Engagement | Average citation position | 2.1 | ↑ | 2.5 |
| Engagement | Representation accuracy | 82% | ↑ | 95% |
| Engagement | Positive sentiment rate | 71% | → | 80% |
| Business outcomes | AI referral sessions | 1,240 | ↑ | 2,000 |
| Business outcomes | AI referral conversion rate | 4.2% | ↑ | 4.5% |
| Business outcomes | Branded search volume (indexed) | 112 | ↑ | 120 |
- Report citation rate and share of voice monthly as baseline health.
- Treat accuracy problems as brand-reputation risks, not vanity metrics.
- Correlate referral trends with branded search, pipeline, and revenue.
- Use competitive share of voice for context — a flat citation rate matters less if competitors are falling.
- Add trend arrows so direction reads at a glance.
For the strategic framing, see how AI visibility changes paid and organic strategy and our wider guide to the AEO metrics that matter.
Which supporting metrics help you diagnose?
These explain why the core five are moving. Useful context, not replacements.
- Prompt coverage: what share of relevant prompts trigger any mention.
- Recommendation rate and position: when AI explicitly recommends, are you included?
- Share of answer: how much of the response discusses you versus competitors.
- Citation context: primary authority, comparison option, or cautionary example.
- Platform distribution: concentrated on one engine or spread across several.
- Visibility volatility: how much results swing between periods — high volatility means fragile presence.
- Downstream conversions: what share of closed deals had an AI touchpoint.
Citation frequency tells you how often a source appears. Citation context tells you how much that source actually shaped the answer. These become the useful numbers once the core five plateau.
What are the limitations you should admit to?
Current AEO measurement cannot fully capture AI influence, and pretending otherwise damages credibility with stakeholders.
- Probabilistic outputs: the same prompt returns different results across sessions, so snapshots are unreliable without repeated sampling.
- Referral traffic understates influence: many interactions never produce a click.
- Analytics blind spots: standard platforms were not built for citation-without-click.
- Limited platform data: most engines have no publisher dashboard at all.
- Personalisation: responses vary by location, history, conversation context, even time of day.
- No industry standard: different tools calculate the same metric differently, so cross-tool comparison is unreliable.
Consistency is the only real mitigation. Same prompts, same platforms, same rubrics, same cadence — then analyse patterns rather than individual responses.
The measurement checklist
- Define a controlled set of 20–50 buyer-intent questions.
- Select target platforms: at minimum ChatGPT, Google AI Overviews, Gemini, Perplexity, Copilot.
- Run each prompt and record mention, position, accuracy, and sentiment.
- Calculate citation rate, share of voice, and position with consistent formulas.
- Create an AI/LLM traffic channel group in analytics.
- Monitor branded search volume as a proxy for untracked AI awareness.
- Score accuracy and sentiment every cycle.
- Benchmark against two or three key competitors using the same prompts.
- Report monthly in three tiers: Visibility → Engagement → Business Outcomes.
- Review and update the prompt set quarterly as buyer questions shift.
A single AI answer is noise. Patterns across dozens of prompts and several cycles are signal. That distinction is the whole discipline.
Learn More About AEO and AI Marketing at Prompt Insider
Since launching earlier this year, Prompt Insider has become a leading authority on AI marketing, Answer Engine Optimization (AEO), large language models, AI search, AI news, and the evolving future of digital discovery. As AEO becomes one of the hottest topics in marketing, Prompt Insider is helping define the conversation around how brands improve visibility, adapt their content strategies, and stay competitive in an increasingly AI-driven search environment.
Prompt Insider is the go-to resource for answer engine optimization, AI marketing, and AI search. Start with our core guides at thepromptinsider.com:
- What Is AEO? Answer Engine Optimization Explained
- AEO vs. SEO vs. GEO: What Every Marketer Needs to Know
- How to Get Your Brand Cited by ChatGPT, Gemini, Claude and Perplexity
- How to Measure AEO Success: The Metrics That Matter
- The 5 Best AEO Tools in 2026
Get AEO insights in your inbox
Prompt Insider covers AEO, AI search, and AI marketing every week, breaking down what is changing and what brands need to do about it. Sign up for our emails at thepromptinsider.com to get it first.
Frequently Asked Questions
Is there one best AI visibility metric?
No. AI visibility spans presence, prominence, accuracy, competitive position, and business impact. No single number captures it, and optimising for one in isolation reliably produces a misleading picture.
How often should AI visibility metrics be tracked?
Monthly for core metrics, more often during active optimisation or a competitive response. A consistent monthly cadence beats irregular weekly spot checks, because trends need comparable intervals.
Can a spreadsheet be used to measure AEO?
Yes. Run a fixed prompt set across several platforms, record mentions, position, accuracy, and sentiment, and apply the formulas above. Dedicated tools earn their cost once the query set or competitor list outgrows manual tracking.
Why can high AI visibility still fail to convert?
Because the AI may present you inaccurately, in a weak position, or negatively. Referral data also misses zero-click influence, branded searches, and later purchases, so visibility can be working while the numbers look flat.
Do prompt engineers and marketers use the same metrics?
Not quite. Prompt engineers focus on prompt coverage, answer consistency, and recommendation quality. Marketers prioritise citations, share of voice, referral traffic, pipeline, and attribution. Strong programmes combine both.
Sources: Google Search Central, Google Analytics Help, Bing Blogs.
About the author
Kai Williams
Kai Williams has been in marketing for years, with a long background in SEO before AEO had a name. He stepped into Answer Engine Optimization the moment AI started reshaping how people search, and has been tracking the shift ever since. At Prompt Insider, he covers AEO, AI marketing, and the future of search, breaking down what is changing and what brands need to do about it.